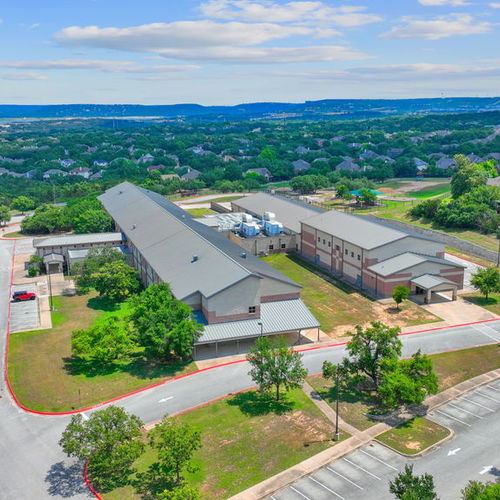

Steiner Ranch sold 19 homes in September, just like last year. The average price still jumped 23 percent.
Year-to-date closings in Steiner Ranch are running 12 percent ahead of last year, and the average sale price has stayed unusually high for four months in a row. The median and price per square foot tell a calmer story.
Nineteen homes closed in Steiner Ranch in September, the same number that closed last September. Through the first nine months of the year, 175 homes have closed, up 12.2 percent from the 156 that had closed by this point last year, according to the monthly figures tracked through Unlock MLS. September itself was steady. The bigger story is how the year has built.
The average sale price rose 23.2 percent from last September. The median rose 3.9 percent and price per square foot rose 4.4 percent. Those three numbers rarely disagree that much unless the mix of homes changes. The average has now landed in seven figures four months in a row, the longest stretch in the three years of data, which points to a steady run of higher-priced closings rather than a jump in what the typical home is worth. It also helps to know that last September's average was unusually low, which makes this year's comparison look larger than it feels.
The longer view is calmer. Over the trailing twelve months, the average close price is down 3.8 percent from the twelve months before it, while the trailing median is up 0.4 percent. Both figures are approximations built from monthly MLS data, so read them as a direction, not a decimal. A strong summer of higher-priced closings has not yet changed the yearly picture.
Pace and inventory do not tell quite the same story. Months of inventory fell to 3.1 from 3.4 a year ago, right at the line between a seller's market and a balanced one, and active listings are down 10.8 percent from last September. Yet the median home took 68 days to sell, up from 48, and the median close-to-original-list ratio slipped to 93.0 percent from 94.0 percent, per the monthly ratios the Austin Board of Realtors tracks. Homes are selling. Buyers are taking their time and negotiating.
What to watch next is whether inventory keeps tightening into the fall. Active listings have dropped from 84 in July to 58 in September, while new listings held close to last year's pace at 15. If new listings stay light and buyers keep showing up, the pace could pick up. For national context, see the National Association of Realtors housing data.
By the numbers
| Metric | Sep 2025 | Sep 2026 | Change |
|---|---|---|---|
| Homes sold | 19 | 19 | No change |
| Median sale price | $799,000 | $830,000 | +3.9% |
| Average sale price | $845,974 | $1,042,542 | +23.2% |
| Median price per sq ft | $248 | $259 | +4.4% |
| Median days to sell | 48 | 68 | +41.7% |
| Close-to-list price ratio | 97.0% | 97.0% | No change |
| Close-to-original-list ratio | 94.0% | 93.0% | −1.0 pts |
| Active listings | 65 | 58 | −10.8% |
| New listings | 14 | 15 | +7.1% |
| Months of inventory | 3.4 | 3.1 | −0.3 |
Watch the October breakdown
In a month where the mix moved this much, the difference matters more than usual. Find out where your home actually sits in this data before you make any decision, not after.
See what your home is worthSource: ABOR. Figures reflect closed single-family sales in Steiner Ranch (78732) for the month shown, compared with the same month one year prior. Medians describe the middle of the month's closed sales and vary with the mix of homes sold. Trailing twelve-month figures are calculated from monthly MLS data and are an approximation, not a recomputed transaction-level figure. For stats specific to your subdivision or home, reach out any time.
Check out this article next