
Steiner Ranch August 2026 Housing Report
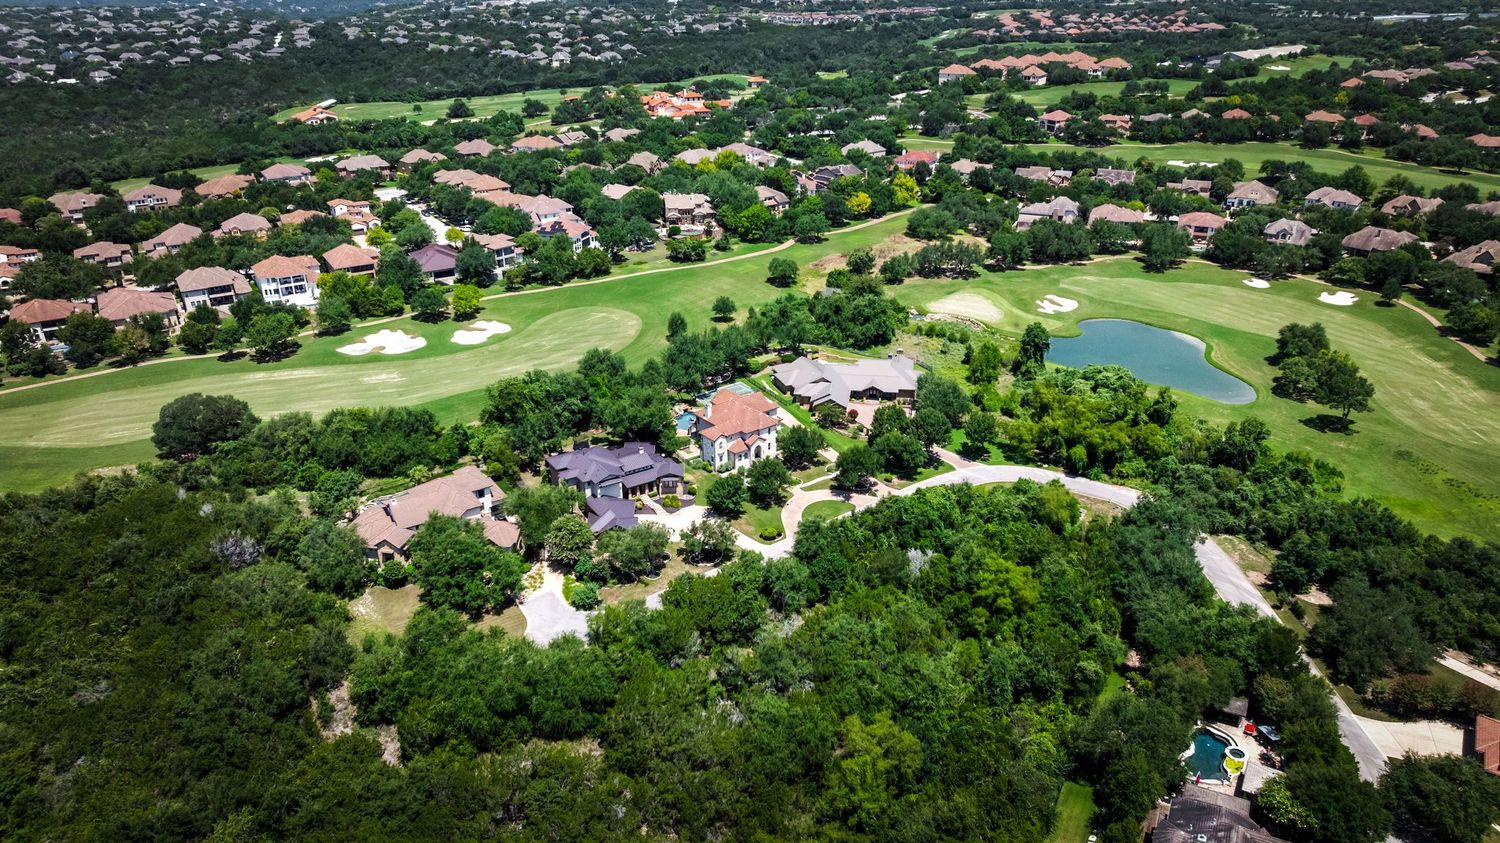
Steiner Ranch just had its busiest month in two years. The price tag says something else.
July delivered the highest single month of home sales Steiner Ranch has posted in more than two years, and the median price fell at the same time. Read together, the numbers tell a very different story than either one does alone.
July 2026 data, published August 2026. Source: ABOR.
Twenty seven homes closed in Steiner Ranch this July, the highest single month in more than two years of data. It capped a run that started building in April, when closings jumped from the mid teens to the mid twenties and held there for four straight months. July's total is nearly triple the ten homes that closed in July of last year. Whatever slowdown talk has circulated this year, the neighborhood's actual closing activity has been building toward one of its strongest stretches on record, not away from it.
That volume surge arrived with a headline that reads worse than it is. The median sale price fell about 21.5 percent from a year ago. Price per square foot, a steadier read on value because it adjusts for home size, fell only about 16.5 percent over the same span. When the median moves further than price per square foot, the usual explanation is a change in the mix of what sold rather than a genuine drop in value, a pattern the Texas Real Estate Research Center has documented in markets where sales volume shifts quickly. With closings nearly tripling, a wider spread of homes traded hands this July than a year ago, and that mix is doing most of the work behind the softer median.
The market underneath that mix shift moved fast. The median home sold in 39 days, down 35 percent from last July's 60. Sellers closed at 98 percent of list price and 95 percent of their original list price, both improvements on a year ago, using the standard ratios tracked by the Austin Board of Realtors. Homes priced to their condition are getting met quickly. Homes that overshoot the market are still the ones giving ground later, but there were fewer of them this month.
Supply stayed just as disciplined. New listings rose about 14 percent from last July, and active inventory actually dipped slightly, because buyers absorbed new homes about as fast as they arrived, per the monthly figures published through Unlock MLS. Divide active listings by the month's sales pace and Steiner Ranch lands at exactly 3.0 months of inventory, the conventional line between a seller's market and a balanced one, down from roughly 8.5 months a year ago. Call it edging into balanced on paper. In practice, the days-to-sell figure and the price ratios above still describe a market that favors sellers, and that gap between the label and the behavior is worth watching.
What to watch in August is whether this pace holds. Four straight months near or above 25 closings is the strongest run in the data, and if it continues, expect the mix story to keep pulling the median around from month to month. If it cools back toward the mid teens seen earlier this year, expect the median to drift back up even without any real change in what homes are worth. Either way, the neighborhood-wide number this month is a poor stand-in for what any single home is worth. Homes priced to their segment and condition, especially ones with an update or two, are the ones getting rewarded right now.
By the numbers
| Metric | Jul 2025 | Jul 2026 | Change |
|---|---|---|---|
| Homes sold | 10 | 27 | +170.0% |
| Median sale price | $1,050,250 | $824,000 | −21.5% |
| Median price per sq ft | $321 | $268 | −16.5% |
| Median days to sell | 60 | 39 | −35.0% |
| Close-to-list price ratio | 97.5% | 98.0% | +0.5 pts |
| Close-to-original-list ratio | 91.5% | 95.0% | +3.5 pts |
| Active listings | 85 | 80 | −5.9% |
| New listings | 29 | 33 | +13.8% |
| Months of inventory | 8.5 | 3.0 | −5.5 |
Watch the July breakdown
In a month where the mix moved this much, the difference matters more than usual. Find out where your home actually sits in this data before you make any decision, not after.
See what your home is worthSource: ABOR. Figures reflect closed single-family sales in Steiner Ranch (78732) for the month shown, compared with the same month one year prior. Medians describe the middle of the month's closed sales and vary with the mix of homes sold. For stats specific to your subdivision or home, reach out any time.
Check out this article next
What Do Inspections Find Most Often in Steiner Ranch Homes?
The most common inspection findings in Steiner Ranch homes are aging HVAC systems and water heaters, weathered roofs, drainage and grading issues on sloped hill…
Read Article